Hydroelectric
| Renewable energy |
|---|
|
Biofuel |
Hydroelectricity is electricity generated by hydropower, i.e., the production of electrical power through the use of the gravitational force of falling or flowing water. It is the most widely used form of renewable energy. Once a hydroelectric complex is constructed, the project produces no direct waste, and has a considerably lower output level of the greenhouse gas carbon dioxide (CO2) than fossil fuel powered energy plants. Worldwide, an installed capacity of 777 GWe supplied 2998 TWh of hydroelectricity in 2006.[1] This was approximately 20% of the world's electricity, and accounted for about 88% of electricity from renewable sources.[2]
Contents
- 1 History
- 2 Electricity generation
- 3 Calculating the amount of available power
- 4 Industrial hydroelectric plants
- 5 Largest hydro-electric plants
- 6 Small-scale hydro-electric plants
- 7 Advantages
- 8 Disadvantages
- 9 Comparison with other methods of power generation
- 10 Countries with the most hydro-electric capacity
- 11 Old hydro-electric power stations
- 12 Major schemes under construction
- 13 Proposed major hydroelectric projects
- 14 Cost
- 15 See also
- 16 Notes
- 17 References
- 18 External links
History
In 1878, the world's first house to be powered with hydroelectricity was Cragside in Northumberland, England. The first Edison hydroelectric power plant - the Vulcan Street Plant - began operating September 30, 1882, in Appleton, Wisconsin, with an output of about 12.5 kilowatts. The Vulcan Street Plant powered two paper mills and a house.[3]
| 20px | This section requires expansion. |
Electricity generation
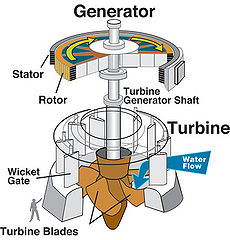
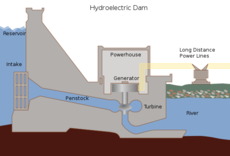
Most hydroelectric power comes from the potential energy of dammed water driving a water turbine and generator. In this case the energy extracted from the water depends on the volume and on the difference in height between the source and the water's outflow. This height difference is called the head. The amount of potential energy in water is proportional to the head. To deliver water to a turbine while maintaining pressure arising from the head, a large pipe called a penstock may be used.
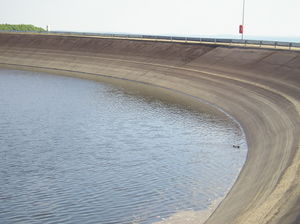
Pumped storage hydroelectricity produces electricity to supply high peak demands by moving water between reservoirs at different elevations. At times of low electrical demand, excess generation capacity is used to pump water into the higher reservoir. When there is higher demand, water is released back into the lower reservoir through a turbine. Pumped storage schemes currently provide the only commercially important means of large-scale grid energy storage and improve the daily capacity factor of the generation system. Hydroelectric plants with no reservoir capacity are called run-of-the-river plants, since it is not then possible to store water. A tidal power plant makes use of the daily rise and fall of water due to tides; such sources are highly predictable, and if conditions permit construction of reservoirs, can also be dispatchable to generate power during high demand periods. Less common types of hydro schemes use water's kinetic energy or undammed sources such as undershot waterwheels.
Calculating the amount of available power
A simple formula for approximating electric power production at a hydroelectric plant is: <math> P = \rho hrgk </math>, where <math>P</math> is Power in watts, <math>\rho</math> is the density of water (~1000 kg/m3), <math>h</math> is height in meters, <math>r</math> is flow rate in cubic meters per second, <math>g</math> is acceleration due to gravity of 9.8 m/s2, and <math>k</math> is a coefficient of efficiency ranging from 0 to 1. Efficiency is often higher (that is, closer to 1) with larger and more modern turbines.
Annual electric energy production depends on the available water supply. In some installations the water flow rate can vary by a factor of 10:1 over the course of a year.
Industrial hydroelectric plants
While many hydroelectric projects supply public electricity networks, some are created to serve specific industrial enterprises. Dedicated hydroelectric projects are often built to provide the substantial amounts of electricity needed for aluminium electrolytic plants, for example. In the Scottish Highlands of the United Kingdom, there are examples at Kinlochleven and Lochaber, constructed during the early years of the 20th century. The Grand Coulee Dam, long the world's largest, switched to support Alcoa aluminum in Bellingham, Washington, United States for American World War II airplanes before it was allowed to provide irrigation and power to citizens (in addition to aluminum power) after the war. In Suriname, the Brokopondo Reservoir was constructed to provide electricity for the Alcoa aluminium industry. New Zealand's Manapouri Power Station was constructed to supply electricity to the aluminium smelter at Tiwai Point. As of 2007 the Kárahnjúkar Hydropower Project in Iceland remains controversial.[4]
Largest hydro-electric plants
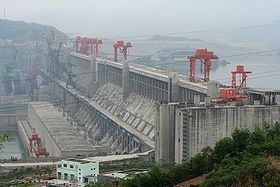
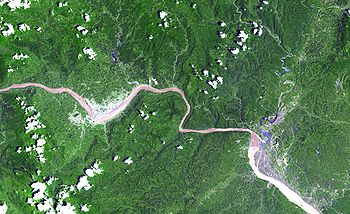
The Three Gorges Dam complex on the Yangtze River in Hubei, China, has the world's largest generating capacity and generates the most electricity in the world. It includes 2 generating stations. They are the Three Gorges Dam (22,500 MW when completed) and Gezhouba Dam (3,115 MW). As of 2009[update], the total generating capacity of this complex is 21,515 MW. The whole project is planned to be completed in 2011, when the total generating capacity will be 25,615 MW. In 2008, this complex generated 97.9 TWh of electricity.
The Itaipu power plant on the Paraná River on the Brazil-Paraguay border currently produces second most hydroelectricity in the world. With 20 generator units and 14,000 MW of installed capacity, in 2008 the Itaipu power plant reached a new historic record for electricity production by generating 94.68 terawatt-hours (340,800 terajoules).
Small-scale hydro-electric plants
Although large hydroelectric installations generate most of the world's hydroelectricity, some situations require small hydro plants. These are defined as plants producing up to 10 megawatts, or projects up to 30 megawatts in North America. A small hydro plant may be connected to a distribution grid or may provide power only to an isolated community or a single home. Small hydro projects generally do not require the protracted economic, engineering and environmental studies associated with large projects, and often can be completed much more quickly. A small hydro development may be installed along with a project for flood control, irrigation or other purposes, providing extra revenue for project costs. In areas that formerly used waterwheels for milling and other purposes, often the site can be redeveloped for electric power production, possibly eliminating the new environmental impact of any demolition operation. Small hydro can be further divided into mini-hydro, units around 1 MW in size, and micro hydro with units as large as 100 kW down to a couple of kW rating.[2]
Small hydro schemes are particularly popular in China, which has over 50% of world small hydro capacity.[2]
Small hydro units in the range 1 MW to about 30 MW are often available from multiple manufacturers using standardized "water to wire" packages; a single contractor can provide all the major mechanical and electrical equipment (turbine, generator, controls, switchgear), selecting from several standard designs to fit the site conditions. Micro hydro projects use a diverse range of equipment; in the smaller sizes industrial centrifugal pumps can be used as turbines, with comparatively low purchase cost compared to purpose-built turbines.
Advantages
Economics
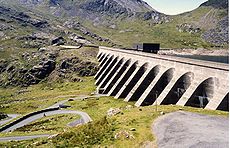
The major advantage of hydroelectricity is elimination of the cost of fuel. The cost of operating a hydroelectric plant is nearly immune to increases in the cost of fossil fuels such as oil, natural gas or coal, and no imports are needed.
Hydroelectric plants also tend to have longer economic lives than fuel-fired generation, with some plants now in service which were built 50 to 100 years ago.[5] Operating labor cost is also usually low, as plants are automated and have few personnel on site during normal operation.
Where a dam serves multiple purposes, a hydroelectric plant may be added with relatively low construction cost, providing a useful revenue stream to offset the costs of dam operation. It has been calculated that the sale of electricity from the Three Gorges Dam will cover the construction costs after 5 to 8 years of full generation.[6]
Greenhouse gas emissions
Since hydroelectric dams do not burn fossil fuels, they do not directly produce carbon dioxide (a greenhouse gas). While some carbon dioxide is produced during manufacture and construction of the project, this is a tiny fraction of the operating emissions of equivalent fossil-fuel electricity generation. One measurement of greenhouse gas related and other externality comparison between energy sources can be found in the ExternE project by the Paul Scherrer Institut and the University of Stuttgart which was funded by the European Commission.[7] According to this project, hydroelectricity produces the least amount of greenhouse gases and externality of any energy source[8]. Coming in second place was wind, third was nuclear energy, and fourth was solar photovoltaic[8]. The extremely positive greenhouse gas impact of hydroelectricity is found especially in temperate climates. The above study was for local energy in Europe; presumably similar conditions prevail in North America and Northern Asia, which all see a regular, natural freeze/thaw cycle (with associated seasonal plant decay and regrowth).
Related activities
Reservoirs created by hydroelectric schemes often provide facilities for water sports, and become tourist attractions in themselves. In some countries, aquaculture in reservoirs is common. Multi-use dams installed for irrigation support agriculture with a relatively constant water supply. Large hydro dams can control floods, which would otherwise affect people living downstream of the project.
Disadvantages
Failure Hazard
Dam failures have been some of the largest man-made disasters in history. Also, good design and construction are not an adequate guarantee of safety. Dams are tempting industrial targets for wartime attack, sabotage and terrorism.
For example, the Banqiao Dam failure in Southern China directly resulted in the deaths of 26,000 people, and another 145,000 from epidemics. Millions were left homeless. Also, the creation of a dam in a geologically inappropriate location may cause disasters like the one of the Vajont Dam in Italy, where almost 2000 people died, in 1963. [10]
Smaller dams and micro hydro facilities create less risk, but can form continuing hazards even after they have been decommissioned. For example, the small Kelly Barnes Dam failed in 1967, causing 39 deaths with the Toccoa Flood, ten years after its power plant was decommissioned in 1957. [11]
Environmental damage
Large reservoirs required for the operation of hydroelectric powerplants result in submersion of extensive areas upstream of the dams, destroying biologically rich and productive lowland and riverine valley forests, marshland and grasslands. The loss of land is often exacerbated by the fact that reservoirs cause habitat fragmentation of surrounding areas.
Hydroelectric projects can be disruptive to surrounding aquatic ecosystems both upstream and downstream of the plant site. For instance, studies have shown that dams along the Atlantic and Pacific coasts of North America have reduced salmon populations by preventing access to spawning grounds upstream, even though most dams in salmon habitat have fish ladders installed. Salmon spawn are also harmed on their migration to sea when they must pass through turbines. This has led to some areas transporting smolt downstream by barge during parts of the year. In some cases dams have been demolished (for example the Marmot Dam demolished in 2007)[12] because of impact on fish. Turbine and power-plant designs that are easier on aquatic life are an active area of research. Mitigation measures such as fish ladders may be required at new projects or as a condition of re-licensing of existing projects.
Generation of hydroelectric power changes the downstream river environment. Water exiting a turbine usually contains very little suspended sediment, which can lead to scouring of river beds and loss of riverbanks.[13] Since turbine gates are often opened intermittently, rapid or even daily fluctuations in river flow are observed. For example, in the Grand Canyon, the daily cyclic flow variation caused by Glen Canyon Dam was found to be contributing to erosion of sand bars. Dissolved oxygen content of the water may change from pre-construction conditions. Depending on the location, water exiting from turbines is typically much warmer than the pre-dam water, which can change aquatic faunal populations, including endangered species, and prevent natural freezing processes from occurring. Some hydroelectric projects also use canals to divert a river at a shallower gradient to increase the head of the scheme. In some cases, the entire river may be diverted leaving a dry riverbed. Examples include the Tekapo and Pukaki Rivers in New Zealand.
Greenhouse gas emissions
Lower positive impacts are found in the tropical regions, as it has been noted that the reservoirs of power plants in tropical regions may produce substantial amounts of methane and carbon dioxide. This is due to plant material in flooded areas decaying in an anaerobic environment, and forming methane, a very potent greenhouse gas. According to the World Commission on Dams report[14], where the reservoir is large compared to the generating capacity (less than 100 watts per square metre of surface area) and no clearing of the forests in the area was undertaken prior to impoundment of the reservoir, greenhouse gas emissions from the reservoir may be higher than those of a conventional oil-fired thermal generation plant.[15] Although these emissions represent carbon already in the biosphere, not fossil deposits that had been sequestered from the carbon cycle, there is a greater amount of methane due to anaerobic decay, causing greater damage than would otherwise have occurred had the forest decayed naturally.
In boreal reservoirs of Canada and Northern Europe, however, greenhouse gas emissions are typically only 2% to 8% of any kind of conventional fossil-fuel thermal generation. A new class of underwater logging operation that targets drowned forests can mitigate the effect of forest decay.[16]
In 2007, International Rivers accused hydropower firms for cheating with fake carbon credits under the Clean Development Mechanism (CDM), for hydropower projects already finished or under construction at the moment they applied to join the CDM. These carbon credits – of hydropower projects under the CDM in developing countries – can be sold to companies and governments in rich countries, in order to comply with the Kyoto protocol.[17]
Population relocation
Another disadvantage of hydroelectric dams is the need to relocate the people living where the reservoirs are planned. In February 2008, it was estimated that 40-80 million people worldwide had been physically displaced as a direct result of dam construction.[18] In many cases, no amount of compensation can replace ancestral and cultural attachments to places that have spiritual value to the displaced population. Additionally, historically and culturally important sites can be flooded and lost.
Such problems have arisen at the Aswan Dam in Egypt between 1960 and 1980, the Three Gorges Dam project in China, the Clyde Dam in New Zealand and the Ilısu Dam in Southeastern Turkey.
Affected by flow shortage
Changes in the amount of river flow will correlate with the amount of energy produced by a dam. Siltation, lower river flows because of drought, climate change or upstream dams and diversions will reduce the amount of live storage in a reservoir therefore reducing the amount of water that can be used for hydroelectricity. The result of diminished river flow can be power shortages in areas that depend heavily on hydroelectric power.
Comparison with other methods of power generation
This section includes a list of references, related reading or external links, but its sources remain unclear because it lacks inline citations. Please improve this article by introducing more precise citations. (August 2008) |
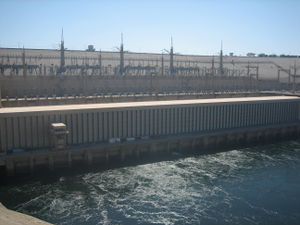
Hydroelectricity eliminates the flue gas emissions from fossil fuel combustion, including pollutants such as sulfur dioxide, nitric oxide, carbon monoxide, dust, and mercury in the coal. Hydroelectricity also avoids the hazards of coal mining and the indirect health effects of coal emissions. Compared to nuclear power, hydroelectricity generates no nuclear waste, has none of the dangers associated with uranium mining, nor nuclear leaks. Unlike uranium, hydroelectricity is also a renewable energy source.
Compared to wind farms, hydroelectricity power plants have a more predictable load factor. If the project has a storage reservoir, it can be dispatched to generate power when needed. Hydroelectric plants can be easily regulated to follow variations in power demand.
Unlike fossil-fueled combustion turbines, construction of a hydroelectric plant requires a long lead-time for site studies, hydrological studies, and environmental impact assessment. Hydrological data up to 50 years or more is usually required to determine the best sites and operating regimes for a large hydroelectric plant. Unlike plants operated by fuel, such as fossil or nuclear energy, the number of sites that can be economically developed for hydroelectric production is limited; in many areas the most cost effective sites have already been exploited. New hydro sites tend to be far from population centers and require extensive transmission lines. Hydroelectric generation depends on rainfall in the watershed, and may be significantly reduced in years of low rainfall or snowmelt. Long-term energy yield may be affected by climate change. Utilities that primarily use hydroelectric power may spend additional capital to build extra capacity to ensure sufficient power is available in low water years.
In parts of Canada (the provinces of British Columbia, Manitoba, Ontario, Quebec, Newfoundland and Labrador) hydroelectricity is used so extensively that the word "hydro" is often used to refer to any electricity delivered by a power utility.[19] The government-run power utilities in these provinces are called BC Hydro, Manitoba Hydro, Hydro One (formerly "Ontario Hydro"), Hydro-Québec and Newfoundland and Labrador Hydro respectively. Hydro-Québec is the world's largest hydroelectric generating company, with a total installed capacity (2007) of 35,647 MW, including 33,305 MW of hydroelectric generation[20].
Countries with the most hydro-electric capacity
The ranking of hydro-electric capacity is either by actual annual energy production or by installed capacity power rating. A hydro-electric plant rarely operates at its full power rating over a full year; the ratio between annual average power and installed capacity rating is the capacity factor. The installed capacity is the sum of all generator nameplate power ratings. Sources came from BP Statistical Review - Full Report 2009[21]
The top six dams, in descending order of their annual electricity generation, are: the Three Gorges Dam in China, the Itaipu Dam on the border of Paraguay and Brazil, the Guri Dam in Venezuela, the Tucurui dam in Brazil, the Sayano-Shushenskaya Dam in Russia and the Krasnoyarsk hydroelectric dam, also in Russia (see List of the largest hydroelectric power stations).
Brazil, Canada, Norway, Switzerland and Venezuela are the only countries in the world where the majority of the internal electric energy production is from hydroelectric power, while Paraguay not only produces 100% its electricity from hydroelectric dams, but exports 90% of its production to Brazil and to Argentina. Norway produces 98–99% of its electricity from hydroelectric sources.[22]
| Country | Annual Hydroelectric Energy Production (TWh) |
Installed Capacity (GW) |
Capacity Factor |
Percent of all electricity |
|---|---|---|---|---|
| |
652.05 | 196.79 | 0.37 | 22.25 |
| |
369.5 | 88.974 | 0.59 | 61.12 |
| |
363.8 | 69.080 | 0.56 | 85.56 |
| |
250.6 | 79.511 | 0.42 | 5.74 |
| |
167.0 | 45.000 | 0.42 | 17.64 |
| |
140.5 | 27.528 | 0.49 | 98.25[22] |
| |
115.6 | 33.600 | 0.43 | 15.80 |
| |
86.8 | - | - | 67.17 |
| |
69.2 | 27.229 | 0.37 | 7.21 |
| |
65.5 | 16.209 | 0.46 | 44.34 |
| |
64.0 | - | - | |
| |
63.4 | 25.335 | 0.25 | 11.23 |
Old hydro-electric power stations
Australia
- A small hydroelectric station, generating 650 kW, opened at Waratah, Tasmania in 1885.
- Duck Reach, Launceston, Tasmania. Completed 1895. The first publicly owned hydro-electric plant in the Southern Hemisphere. Supplied power to the city of Launceston for street lighting.
- The Snowy Mountains Scheme has turbines all along the tunnel so it, in some perspectives it is also another hydroelectric station. However, it only operates during peak hours of the day and mostly during the evening and early night. It supplies electricity to all over the regions of New South Wales.
Canada
- Decew Falls 1, St. Catharines, Ontario completed 25 August 1898. Owned by Ontario Power Generation. Four units are still operational. Recognized as an IEEE Milestone in Electrical Engineering & Computing by the IEEE Executive Committee in 2002.
- The oldest continuously operated hydroelectric generator in Canada is located in St. Stephen, New Brunswick. Part of the construction of the Milltown Cotton Mill, this rope-driven generator originally powered the electric lights for the mill when it opened in 1882, and in 1888 started providing power to homes in the town. NB Power now owns and operates this as part of the Milltown Dam hydroelectric station.
Chile
- Chivilingo was the first hydroelectric plant in Chile and the second in South America. With first power produced in 1897, it has two Pelton wheel turbines each turning a 215 kW generator. It was installed to provide power to mines and the city of Lota, Chile.[24]
United States
- Appleton, Wisconsin completed 1882, A waterwheel on the Fox river supplied the first commercial hydroelectric power for lighting to two paper mills and a house, two years after Thomas Edison demonstrated incandescent lighting to the public. Within a matter of weeks of this installation, a power plant was also put into commercial service at Minneapolis.
- Niagara Falls, New York. Operation began locally in 1895 and power was transmitted to Buffalo, New York, in 1896.
- Claverack Creek, in Stottville, New York, believed to be the oldest hydro power site in the United States. The turbine, a Morgan Smith, was constructed in 1869 and installed 2 years later. It is one of the earliest water wheel installations in the United States to generate electricity. It is owned today by Edison Hydro.[citation needed]
- The oldest continuously operated commercial hydroelectric plant in the United States is built on the Hudson River at Mechanicville, New York. The seven 750 kW units at this station initially supplied power at a frequency of 38 Hz, but later were increased in speed to 40 Hz. It went into commercial service 22 July 1898. It is now being restored to its original condition and remains in commercial operation.[25]
Major schemes under construction
This section includes a list of references, related reading or external links, but its sources remain unclear because it lacks inline citations. Please improve this article by introducing more precise citations. (August 2008) |
Only projects with generating capacity greater than or equal to 2,000 MW are listed.
| Name | Maximum Capacity | Country | Construction started | Scheduled completion | Comments | |
|---|---|---|---|---|---|---|
| Xiluodu Dam | 12,600 MW | China | December 26, 2005 | 2015 | Construction once stopped due to lack of environmental impact study. | |
| Siang Upper HE Project | 11,000 MW | India | April, 2009 | 2024 | Multi-phase construction over a period of 15 years. Construction was delayed due to dispute with China.[citation needed] | |
| TaSang Dam | 7,110 MW | Burma | March, 2007 | 2022 | Controversial 228 meter tall dam with capacity to produce 35,446 Ghw annually. | |
| Xiangjiaba Dam | 6,400 MW | China | November 26, 2006 | 2015 | ||
| Longtan Dam | 6,300 MW | China | July 1, 2001 | December 2009 | ||
| Nuozhadu Dam | 5,850 MW | China | 2006 | 2017 | ||
| Jinping 2 Hydropower Station | 4,800 MW | China | January 30, 2007 | 2014 | To build this dam, 23 families and 129 local residents need to be moved. It works with Jinping 1 Hydropower Station as a group. | |
| Laxiwa Dam | 4,200 MW | China | April 18, 2006 | 2010 | ||
| Xiaowan Dam | 4,200 MW | China | January 1, 2002 | December 2012 | ||
| Jinping 1 Hydropower Station | 3,600 MW | China | November 11, 2005 | 2014 | ||
| Pubugou Dam | 3,300 MW | China | March 30, 2004 | 2010 | ||
| Goupitan Dam | 3,000 MW | China | November 8, 2003 | 2011 | ||
| Guanyinyan Dam | 3,000 MW | China | 2008 | 2015 | Construction of the roads and spillway started. | |
| Lianghekou Dam[26] | 3,000 MW | China | 2009 | 2015 | ||
| Boguchan Dam | 3,000 MW | Russia | 1980 | 2010 | ||
| Chapetón | 3,000 MW | Argentina | ||||
| Dagangshan | 2,600 MW | China | August 15, 2008[27] | 2014 | ||
| Jinanqiao Dam | 2,400 MW | China | December 2006 | 2010 | ||
| Guandi Dam | 2,400 MW | China | November 11, 2007 | 2012 | ||
| Liyuan Dam | 2,400 MW | China | 2008[28] | |||
| Tocoma Dam Bolívar State | 2,160 MW | Venezuela | 2004 | 2014 | This new power plant would be the last development in the Low Caroni Basin, bringing the total to six power plants on the same river, including the 10,000MW Guri Dam.[29] | |
| Ludila Dam | 2,100 MW | China | 2007 | 2015 | Construction halt due to lack of the evnironmental assessment. | |
| Shuangjiangkou Dam | 2,000 MW | China | December, 2007[30] | The dam will be 314 m high. | ||
| Ahai Dam | 2,000 MW | China | July 27, 2006 | |||
| Subansiri Lower Dam | 2,000 MW | India | 2005 | 2012 |
Proposed major hydroelectric projects
This section includes a list of references, related reading or external links, but its sources remain unclear because it lacks inline citations. Please improve this article by introducing more precise citations. (August 2008) |
Only projects with generating capacity greater than or equal to 2,000 MW are listed.
| Name | Maximum Capacity | Country | Construction starts | Scheduled completion | Comments | |
|---|---|---|---|---|---|---|
| Red Sea dam | 50,000 MW | Africa/Middle East | Unknown | Unknown | Still in planning, would be largest dam in the world | |
| Grand Inga | 40,000 MW | Democratic Republic of the Congo | 2010 | Unknown | ||
| Baihetan Dam | 13,050 MW | China | 2009 | 2015 | Still in planning | |
| Belo Monte Dam | 11,233 MW | Brazil | Unknown | 2014 | Provisional environmental license approved | |
| Wudongde Dam | 7,500 MW | China | 2009 | 2015 | Still in planning | |
| Rampart Dam | 4,500 MW | United States | Canceled | |||
| Maji Dam | 4,200 MW | China | 2008 | 2013 | ||
| Songta Dam | 4,200 MW | China | 2008 | 2013 | ||
| Liangjiaren Dam | 4,000 MW | China | 2009 | 2015 | Still in planning | |
| Jirau Dam | 3,300 MW | Brazil | 2007 | 2012 | ||
| Pati Dam | 3,300 MW | Argentina | ||||
| Santo Antônio Dam | 3,150 MW | Brazil | 2007 | 2012 | ||
| Dibang Dam | 3,000 MW | India | ||||
| Lower Churchill | 2,800 MW | Canada | 2009 | 2014 | ||
| HidroAysén | 2,750 MW | Chile | 2020 | |||
| Lenggu Dam | 2,718 MW | China | 2015 | |||
| Changheba Dam | 2,200 MW | China | 2009 | 2015 | ||
| Subansiri Upper HE Project | 2,500 MW | India | 2012 | Unknown | ||
| Banduo 1 Dam | 2,000 MW | China | 2009 |
Cost
United States
In the United States, a study is required before constructing a hydroelectric project. In 2008, a study could cost up to $50,000 for a 100 feet (30 m) run of a stream. Both federal and state licenses were required. A license typically cost between $150,000 and $1 million. A project earns money from the sale of energy, the sale of capacity, and the sale of renewable energy credits.[31]
See also
Lua error in package.lua at line 80: module 'Module:Portal/images/e' not found.
- Relative cost of electricity generated by different sources
- Economics of new nuclear power plants
- Wind power
- Renewable energy
- Nuclear power
- Solar energy
- Hydroelectricity
Topics:
- Environmental concerns with electricity generation
- Environmental impacts of reservoirs
- Hydropower
- Pumped-storage hydroelectricity
- Run-of-the-river hydroelectricity
- Small hydro
- Water power engine
Lists:
- List of countries by electricity production from renewable sources
- List of the largest hydroelectric power stations
- List of reservoirs and dams
Categories:
Organisations:
Notes
Cite error: Invalid <references> tag;
parameter "group" is allowed only.
<references />, or <references group="..." />References
- World Commission on Dams (November 16, 2000). "Dams and Development – A New Framework for Decision-Making". Retrieved 2009-05-10.
- New Scientist report on greenhouse gas production by hydroelectric dams.
- International Water Power and Dam Construction Venezuela country profile
- International Water Power and Dam Construction Canada country profile
- Tremblay, Varfalvy, Roehm and Garneau. 2005. Greenhouse Gas Emissions - Fluxes and Processes, Springer, 732 p.
External links
| 40x40px | Wikimedia Commons has media related to Hydroelectric power. |
- International Hydropower Association
- Hydroelectric at the Open Directory Project
- Mechanicville Hydroelectric Station Tour at YouTube
- National Hydropower Association, USA
- Hydropower Reform Coalition, USA
- Lecture - 10 Hydroelectric Power at YouTube and Lecture - 11 Hydroelectric Power at YouTube
- Interactive site that demonstrates dams' effects on rivers
- Center of expertise on hydropower impacts on fish and fish habitat, Canada
- Hydro-Québec
- CBC Digital Archives – Hydroelectricity: The Power of Water
- University of Washington Libraries – Seattle Power and Water Supply Collection
- International Rivers
- United States Federal Energy Regulatory Commission (FERC)
- European Small Hydropower Association
- Power at Niagara Falls Niagara Falls Public Library (Ont.)
- Milford Hydroelectric Station Restoration Tour Built by Henry Ford in 1939
- 60,000,000 Horsepower Ready to be Harnessed for Work: when these giants are set in action, the real age of electricity will begin and our dreams will become realities, Popular Science monthly, February 1919, page 46-47, Scanned by Google Books: http://books.google.com/books?id=7igDAAAAMBAJ&pg=PA46
- ↑ http://www.eia.doe.gov/ Energy Information Administration international statistics database
- ↑ 2.0 2.1 2.2 Renewables Global Status Report 2006 Update, REN21, published 2007, accessed 2007-05-16; see Table 4, p. 20.
- ↑ Hydroelectric power - energy from falling water Clara.net
- ↑ Summer of International dissent against Heavy Industry, Saving Iceland, published 2007, accessed 2007-05-17
- ↑ Hydropower – A Way of Becoming Independent of Fossil Energy?
- ↑ Beyond Three Gorges in China
- ↑ Lua error in package.lua at line 80: module 'Module:Citation/CS1/Suggestions' not found.
- ↑ 8.0 8.1 "External costs of electricity systems (graph format)". ExternE-Pol. Technology Assessment / GaBE (Paul Scherrer Institut). 2005. Retrieved 2009-09-01.
- ↑ Stay Clear, Stay Safe, Ontario Power Generation
- ↑ See the references for the articles in the list of Dam failures. Duplicating them here is wasteful.
- ↑ Toccoa Flood USGS Historical Site, retrieved 02sep2009
- ↑ "Sandy River – Marmot Dam's removal in 2007 has returned the Sandy River to a wild, free-flowing river". Portland General Electric. Retrieved 2009-05-10.
- ↑ Sedimentation Problems with Dams
- ↑ WCD Findal Report, Retrieved 7/10/2009
- ↑ Hydroelectric power's dirty secret revealed
- ↑ Inhabitat » “Rediscovered” Wood & The Triton Sawfish
- ↑ Nick Davies (3 December 2007). "Power firms accused of emissions trade cheating". The Guardian. Retrieved 2009-05-10.
- ↑ Briefing of World Commission on Dams
- ↑ http://archives.cbc.ca/economy_business/energy/topics/1750/
- ↑ Hydro-Québec. 2007 Annual Report. Montreal, April 2008.
- ↑ Consumption TWh'!A1
- ↑ 22.0 22.1 "Binge and purge". The Economist. 2009. Retrieved 2009-01-30.
98-99% of Norway’s electricity comes from hydroelectric plants.
- ↑ [nyj.ndrc.gov.cn/ggtz/W020100106293569392607.doc]
- ↑ Carl Sulzberger, The Chivilingo Plant- Early Hydropower in Chile, in IEEE Power & Energy, Volume 6, No. 4 July/August 2008, ISSN 1540-7977, pg. 60
- ↑ The Historic Mechanicville Hydroelectric Station Part 1: The Early Days, IEEE Industry Applications Magazine, Jan/Feb. 2007
- ↑ http://www.ehdc.com.cn/newsite/DisplayNewsMaster/ShowNews.aspx?Id=1175
- ↑ http://www.cb600.cn/info_view.asp?id=1357280
- ↑ http://zt.xxgk.yn.gov.cn/canton_model12/newsview.aspx?id=368628
- ↑ Staff (2004). "Caroní River Watershed Management Plan" (PDF). Inter-America Development Bank. Retrieved 2008-10-25.
- ↑ http://www.cjwsjy.com.cn/News/Company/200808055706.htm
- ↑ Gresser, Joseph (August 20, 2008). Panel considers small hydro power potential. the Chronicle.
- Pages with script errors
- Pages with broken file links
- Articles using small message boxes
- Articles to be expanded from January 2010
- Articles with invalid date parameter in template
- All articles to be expanded
- Articles containing potentially dated statements from 2009
- All articles containing potentially dated statements
- Articles lacking in-text citations from August 2008
- All articles lacking in-text citations
- All articles with unsourced statements
- Articles with unsourced statements from February 2007
- Articles with unsourced statements from February 2010
- Commons category with local link different than on Wikidata
- Hydroelectricity
- Landscape
- Sustainable technologies
