File:Airdosechernobyl2.png
| <wm-license-information-description> |
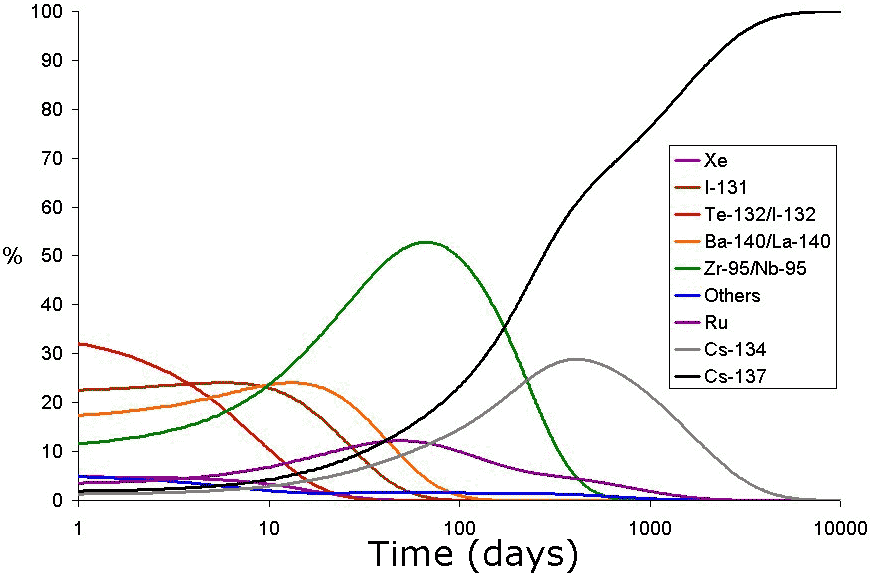
The contributions made by the different isotopes to the dose (in air) caused in the contaminated area in the time shortly after the accident. Note that this image was drawn using data from the OECD report, [1] and the second edition of 'The radiochemical manual'. | ||
|---|---|---|---|
| <wm-license-information-date> |
18 {{MediaWiki:February/<lang>}} 2006 | ||
| <wm-license-information-source> | |||
| <wm-license-information-author> | |||
| <wm-license-information-permission> ([[<wm-license-information-permission-reusing-link>|<wm-license-information-permission-reusing-text>]]) |
| ||
| <wm-license-information-other-versions> | wikipedia:en:Image:Airdosechernobyl2.jpg |
File history
Click on a date/time to view the file as it appeared at that time.
| Date/Time | Thumbnail | Dimensions | User | Comment | |
|---|---|---|---|---|---|
| current | 19:44, 11 June 2010 | | 873 × 574 (22 KB) | Jontas (Talk | contribs) | {{Information |Description=The contributions made by the different isotopes to the dose (in air) caused in the contaminated area in the time shortly after the accident. Note that this image was drawn using data from the OECD report, [http://atom.kaeri.re. |
- You cannot overwrite this file.
File usage
The following page links to this file: